HailHero
Hail damage assessment tool with 6,000+ geocoded claims and automated reporting.
HailHero is a data-driven assessment platform built for the insurance claims management industry. The tool geocodes and visualizes thousands of historical hail damage claims across Queensland, enabling rapid damage assessment, area-based risk profiling, and automated report generation. It transforms raw claims data into actionable intelligence for field teams and assessors working across storm-affected regions.
React + Google Maps + Data Engineering
Turning claims data into actionable intelligence.
A specialized geospatial tool that maps storm damage patterns and automates the assessment workflow for field teams.

Geospatial Data Platform
6,000+ claims geocoded and visualized.
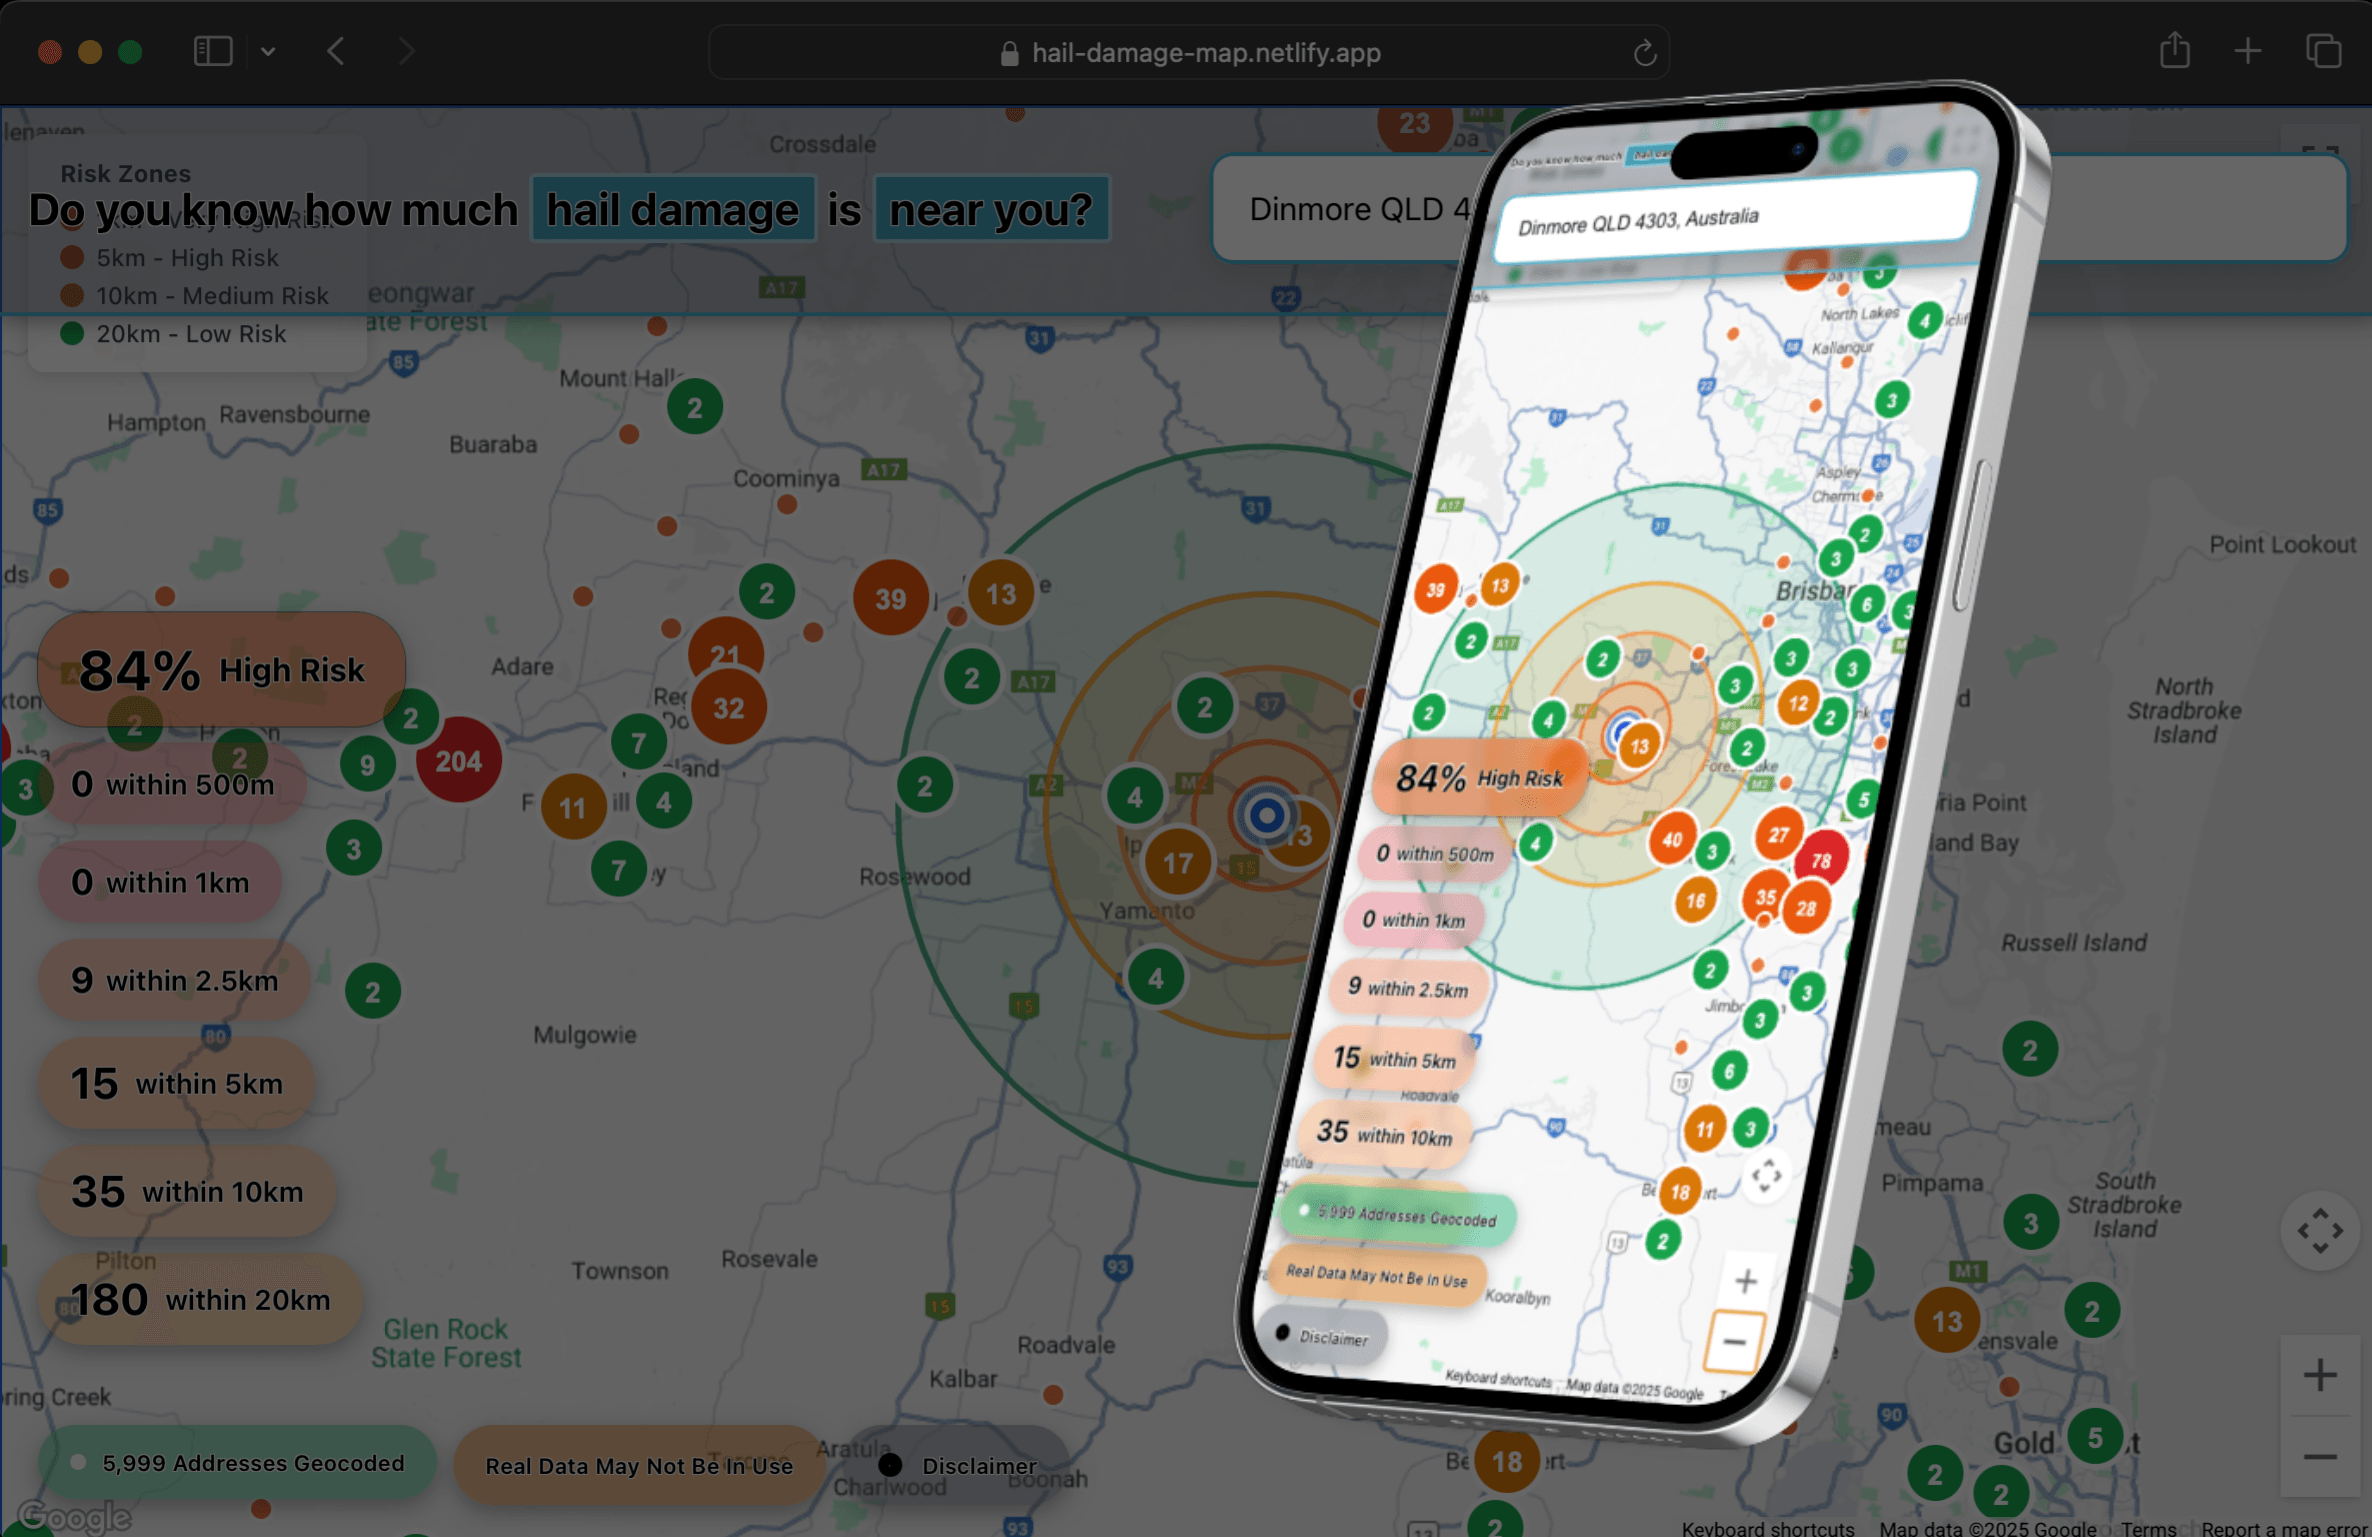
The platform ingests claims data from CSV pipelines, geocodes addresses through the Google Maps API, and renders them as interactive map clusters. Users can filter by date range, damage severity, suburb, and claim status. The heatmap visualization instantly reveals storm corridors and high-density damage areas, enabling teams to prioritize field inspections and allocate resources where they're needed most. Historical data overlays show storm recurrence patterns for long-term planning.
Automated Reporting and Data Pipeline
From raw data to field-ready reports.
The data engineering pipeline processes bulk claims data through Python scripts that handle address normalization, geocoding with retry logic and rate limiting, and enrichment with weather event data. The automated reporting system generates area summaries, individual claim assessments, and team allocation recommendations. Reports export as PDF with embedded maps showing the specific claim locations and surrounding damage density.
The React frontend provides real-time filtering with instant map updates, powered by Supabase Postgres with PostGIS extensions for spatial queries. Field teams access a mobile-optimized view that shows their assigned areas with navigation integration. The admin dashboard tracks assessment progress, team coverage, and pipeline throughput metrics. Built to handle the surge patterns typical of storm events, where thousands of claims arrive within days of a weather event.
Data Normalization and Geocoding at Scale
Converting raw claims data into accurate geographic coordinates.
Raw claims data is often messy — addresses are formatted inconsistently, suburb names vary, postcodes might be missing or incorrect. The HailHero pipeline starts with data cleaning: standardizing address formats, extracting suburb and postcode, flagging incomplete records. Then comes geocoding — converting addresses into latitude/longitude coordinates via the Google Maps API. This is computationally expensive at scale (6000+ addresses), so the pipeline batches requests, implements rate limiting to stay within API quotas, and caches results to avoid re-geocoding the same address. Failed geocodes are logged for manual review and fallback geocoding strategies (city centroid) are applied to ensure no claim is unmapped.
PostGIS Spatial Queries and Heatmaps
Geographic analysis with database-native spatial queries.
Once claims are geocoded, Supabase's PostGIS extension enables sophisticated geographic queries. Asking "how many claims are within 2km of this location?" becomes a single SQL query rather than iterating through 6000 records in the application. PostGIS can compute claim density heatmaps, identify high-concentration areas, and analyze damage corridors following storm tracks. The React frontend queries these heatmaps and renders them using Mapbox GL, coloring areas by damage density. Users can dynamically adjust search radius, date ranges, and damage severity filters, with the database returning results in milliseconds.
This geospatial analysis is particularly valuable during active storm events. When hail falls across a region, HailHero ingests claims as they arrive, and the heatmap immediately updates to show where teams should focus assessment efforts. High-density areas might be prioritized for faster response. Insurance underwriters can see damage corridors to understand risk patterns. Field teams can see their assigned areas and navigate efficiently. This real-time geospatial intelligence is what transforms HailHero from a simple database query tool into a strategic operations asset.
Mobile Field Teams and Offline Capability
Field assessors need maps and claim data even without connectivity.
Field teams assessing hail damage work in areas that might have spotty mobile coverage. The HailHero mobile app downloads maps and claim data for their assigned area before heading to the field, enabling offline access. The app shows assigned claims as map pins, with tap-to-navigate integration to Google Maps or Apple Maps. Assessors can photograph damage, record damage severity ratings, and note observations — all stored locally. When connectivity returns, data syncs to the backend and updates the admin dashboard. This offline-first architecture is critical for operations during peak storm periods when many teams are simultaneously in the field across a wide geographic area.
Analytics and Historical Pattern Analysis
Understanding long-term storm and damage patterns.
Beyond immediate storm response, HailHero's historical claims database enables pattern analysis. Which suburbs are hit hardest by hail? What's the seasonal pattern of storms? Are certain areas recurring high-risk zones? This historical analysis informs insurance underwriting, pricing decisions, and long-term risk mitigation planning. BigQuery integration allows advanced analytics: querying trends over multiple years, correlating hail damage with other weather events, and predictive modeling of future damage likelihood. This data-driven approach transforms reactive claims management into proactive risk planning.
For a Gold Coast insurance company managing hail damage claims, this historical perspective is invaluable. Storm patterns vary by season and geography. Understanding these patterns at a granular level — specific suburbs in spring tend to have more hail damage, or particular construction types are more vulnerable — enables better resource planning and strategic business decisions. The system that was built for immediate storm response becomes a strategic intelligence tool.
Insurance Claims Management on the Gold Coast
Specialized tools for specialized domains.
HailHero demonstrates how generic technology stack choices (React, Supabase, Google Maps) become specialized tools when applied with domain expertise. Insurance claims management is a highly specialized domain with unique challenges: rapid data ingestion during crisis events, complex geographic considerations, regulatory compliance, and the need for rapid team coordination. A generic project management tool or CRM is insufficient. But HailHero shows that building a specialized tool doesn't require exotic technology — it requires deep understanding of the domain, thoughtful architecture, and attention to user workflows.
Peak Load Performance and System Reliability
Systems must scale when demand is highest.
Most insurance claims arrive during and immediately after storm events. The system must handle thousands of claims arriving in a narrow time window while remaining responsive to field teams and assessors. This peak load challenge requires thoughtful architecture. The database uses indexes optimized for common queries (claims by location, claims by date, claims by status). The frontend implements pagination for large result sets so the browser doesn't try to render 6000 claims at once. The mobile app is lightweight to work on lower-bandwidth cellular connections that are common in storm-affected areas. Automated data pipeline jobs are scheduled during off-peak hours rather than competing with user requests during peak demand.
System reliability is critical when claims teams are under time pressure to assess damage before memory fades or additional weather damage occurs. Downtime means lost productivity and lost data. HailHero implements automated backups, monitoring and alerting for performance degradation, and graceful error handling that keeps the application functioning even if some components fail. If the map tile server has issues, the application falls back to a simpler map view rather than crashing. If the geocoding API has rate limit issues, jobs queue for retry rather than silently failing. This resilience is the difference between a tool that's "usually available" and a tool that field teams can depend on during critical incidents.
Need a data-driven application?
Let's connect.




From the blog
Latest thinking
Tech news, design insights, and development deep-dives from the Gold Coast.