Marketing Dashboards
Automated CPA tracking dashboards with BigQuery and Google Ads API integration.
A suite of custom marketing dashboards that pull real-time data from Google Ads, Facebook Ads, and CRM systems into BigQuery for unified cost-per-acquisition tracking across all campaigns. The dashboards automate the reporting workflow that previously required hours of manual spreadsheet work each week, providing instant visibility into campaign performance, budget pacing, and conversion attribution at the channel and campaign level. For Gold Coast digital marketing agencies and in-house marketing teams managing budgets across multiple advertising platforms, these dashboards transform marketing from an art practiced in spreadsheets into a data-driven discipline backed by real-time metrics. The shift from manual reporting to automated dashboards frees marketing teams to focus on strategy and optimization rather than data collection.
BigQuery + Google Ads API + Python
Real-time marketing intelligence, fully automated.
Unified campaign performance data across Google, Facebook, and CRM — updated automatically, accessible instantly. The architecture uses Python for ETL (extract-transform-load) orchestration, running scheduled jobs that pull data from advertising APIs and load it into BigQuery on a regular cadence — typically hourly for near-real-time reporting. The data pipeline handles authentication, rate limiting, error recovery, and data validation automatically. If an API call fails, the system retries with exponential backoff. If data is malformed, validation rules catch it and alert. The goal is a data pipeline that's reliable enough to drive business decisions without requiring manual intervention.
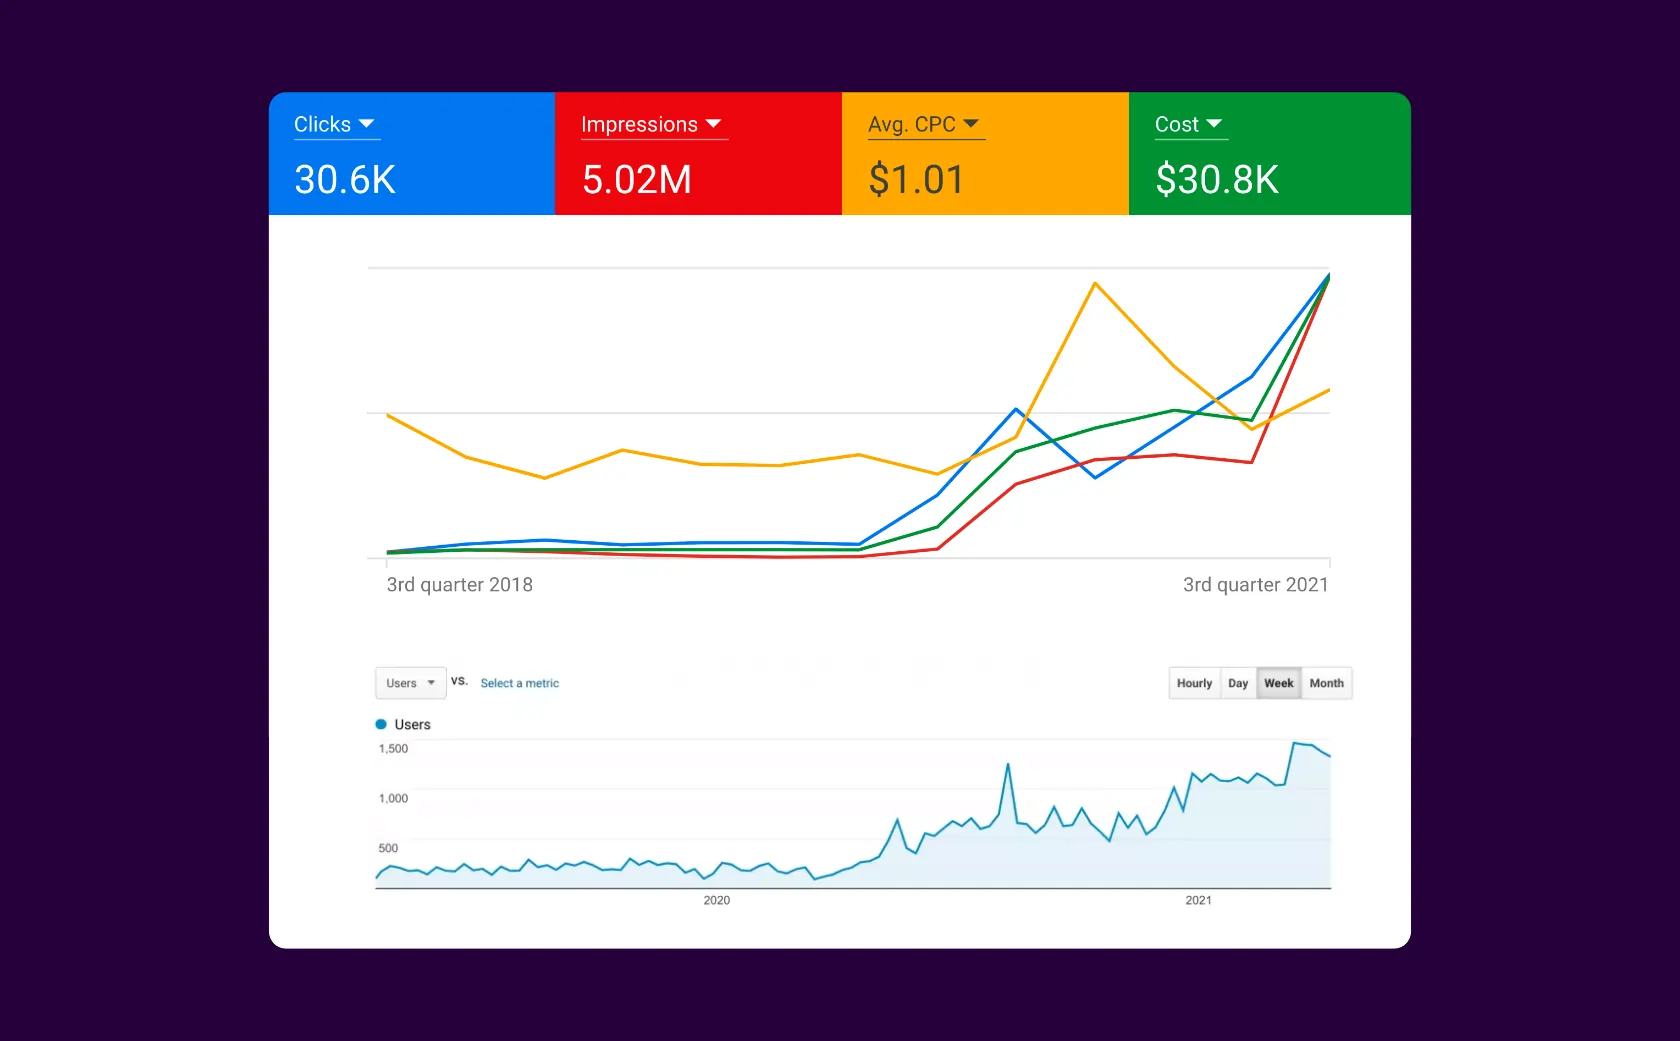
Data Pipeline Architecture
Automated data ingestion from multiple ad platforms.
The data pipeline runs on scheduled Python scripts that pull campaign metrics from the Google Ads API, Facebook Marketing API, and CRM export endpoints. Raw data lands in BigQuery staging tables, then transforms through SQL views that normalize metrics across platforms — unifying different attribution models, currency formats, and conversion definitions into a single consistent schema. The pipeline handles API rate limits, retry logic, and data validation with alerting on anomalies. The Google Ads API is particularly complex because Google reports data at multiple granularity levels. Campaign-level data shows aggregate performance. Ad group level shows performance broken down by ad grouping within a campaign. Ad-level data shows performance of individual creative assets. Keyword-level data shows performance of specific search terms. Device-level data breaks down performance by desktop, mobile, tablet. The ETL pipeline ingests all of these levels, creating a normalized data model that allows analysis at any granularity. This gives dashboard users complete flexibility to ask any question about campaign performance. Facebook's data format is different again. Facebook groups conversions by pixel and action type. Different pixels can track the same action differently. Attribution windows vary (1-day click, 7-day click, 28-day click, 1-day view). The normalization layer handles these differences, creating a unified conversion definition across platforms so marketing teams can compare apples to apples. A customer who converted via Google Ads is counted the same way as a customer who converted via Facebook, even though the platforms report differently. The CRM integration adds another layer of sophistication. After a customer converts through an ad, they enter your CRM system. You can track their customer lifetime value, whether they actually generate revenue or just waste your marketing budget. By connecting CRM data back to the ad campaign that brought them in, you can calculate true return on ad spend — not just "did they click," but "did they actually become profitable customers." This requires careful matching — the same customer record in CRM needs to be linked back to the ad conversion that triggered them. The pipeline handles this through hashed email matching, user ID matching, or phone number matching depending on what data is available.
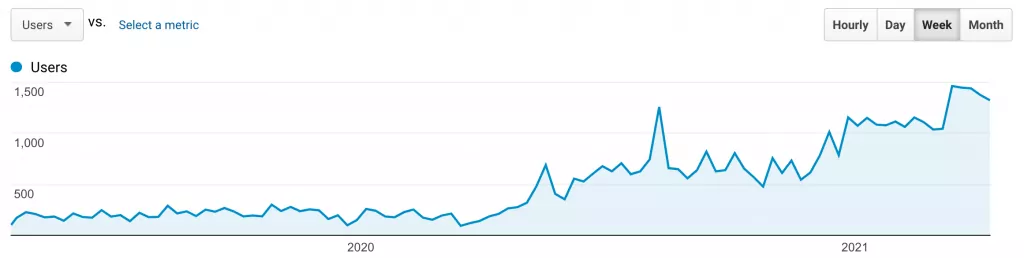
Dashboard and Reporting Layer
From raw API data to executive-ready reports.
The dashboard layer presents unified CPA, ROAS, and conversion volume metrics across all active campaigns. Drill-down views allow filtering by date range, campaign type, geographic region, and conversion action. Budget pacing indicators show real-time spend against monthly targets with projected end-of-month forecasts. The attribution model comparison view shows how different windows affect reported CPA, helping optimize budget allocation decisions. For marketing teams on the Gold Coast running sophisticated multi-channel campaigns, this level of insight is transformative. Rather than discovering after the month ends that a campaign was underperforming, real-time dashboards surface issues days in advance, allowing immediate optimization. The drill-down capability deserves special attention because it's where dashboards move from informational to actionable. An executive sees "overall CPA increased 15%," which is concerning. They drill down to see which campaigns caused the increase — Facebook campaigns, specifically. They drill deeper into Facebook campaigns and see that only one campaign is responsible. They then drill into that campaign and see it's a specific audience segment driving high CPA. With this information, they can take action: pause that audience segment, adjust targeting, or test new creative. Without this multi-level drill-down, they might have made broad decisions affecting all campaigns when the issue was actually isolated. The structure of the dashboard enables precise decision-making. The forecasting capability uses historical data to predict outcomes. If a campaign has spent $2,000 and generated 30 conversions so far this month, that's $66.67 CPA. If the month-to-date average cost per click is $1.50 and you've spent $10,000 with remaining budget of $20,000, the system projects spending another 13,333 clicks worth of budget, which might generate another 60 conversions if the conversion rate holds. That would bring you to 90 total conversions and $1,111 CPA for the month. If your target CPA is $50, the system flags this as at-risk. You have time to make changes — adjust targeting to improve conversion rate, reduce spend on this campaign and shift to better performers, or pause the campaign entirely if it's unviable. These forecasts are constantly updating as new data comes in, so the risk profile changes dynamically.
Automated weekly reports generate and distribute via email, summarizing key performance shifts and flagging campaigns that have moved outside target CPA thresholds. The alerting system triggers notifications when daily spend exceeds pace, when conversion rates drop below historical baselines, or when API ingestion fails. Stakeholders who never log into the dashboard still get regular updates summarizing what matters. The entire system replaced 6+ hours of weekly manual reporting with real-time, always-current data accessible through a single dashboard. For marketing teams, that's a week converted per person per year that can be redirected toward strategy and optimization instead of data collection. For an agency managing dashboards for multiple clients, the multiplier effect is even more dramatic — eliminate 6 hours per client per week across 10 clients and you've freed 60 hours per week for actual client strategy work.
Need custom marketing analytics?
Let's connect.



From the blog
Latest thinking
Tech news, design insights, and development deep-dives from the Gold Coast.