



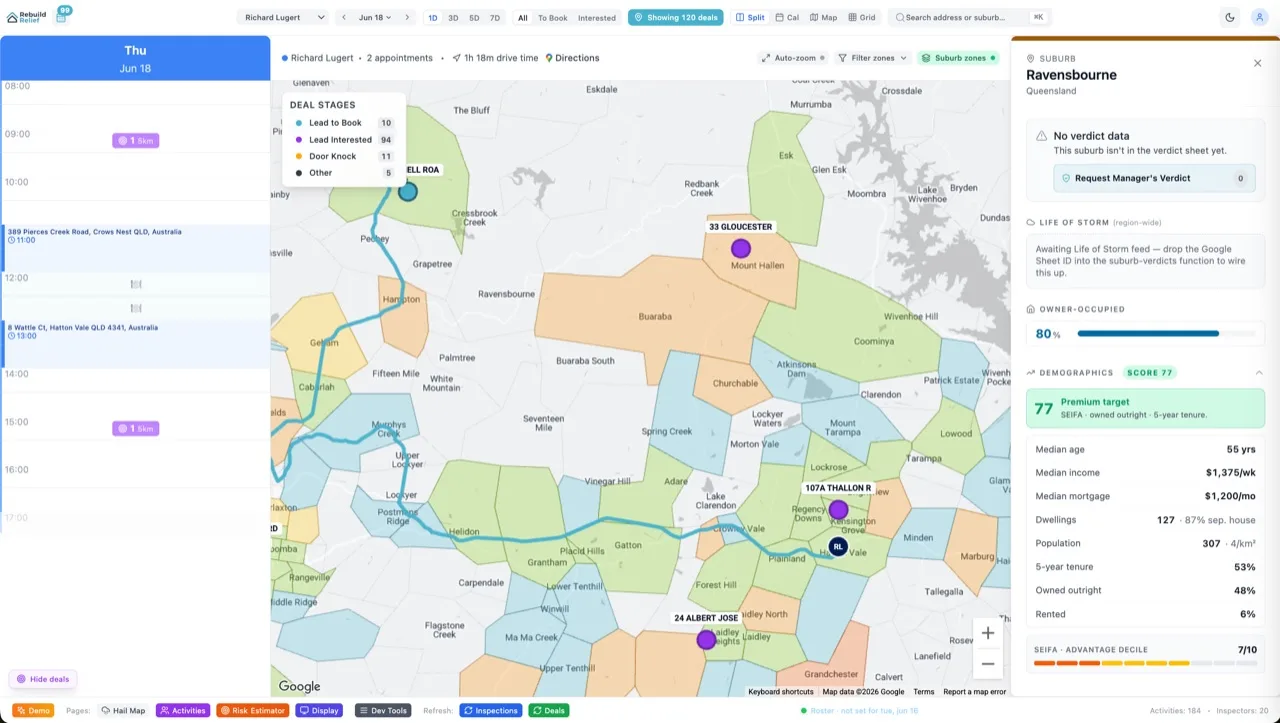

Most marketing sites that show SaaS dashboards load Chart.js, Recharts, or Nivo — complete with axis logic, tooltip handlers, and data transformations. Then they layer a React component, add animation plugins, and ship 40–80KB of JavaScript just to loop a chart up and down. Velocity X does something different: three CSS-only animated dashboards (a CRM contact map with pulsing pins, a multi-channel attribution chart, and a remarketing flow diagram) that animate in a loop, feel real enough to sell, and weigh 6KB total with zero JavaScript overhead. This is how.
Why CSS Animations Beat JS Chart Libraries for Marketing Teasers
A marketing dashboard teaser isn't a real dashboard. You're not interacting with it, sorting columns, or drilling into data. You're watching a looped performance — a sales demo that plays silently while you read copy above it. Chart.js is architected for real-time, interactive charting. Recharts is a React library designed for complex filtering and responsive layouts. Both are excellent for dashboards users actually use. Both are wildly overengineered for a looped animation on a marketing page.
CSS animations run on the compositor thread — hardware-accelerated, 60fps, zero jank. JavaScript chart libraries run on the main thread. That means every animation frame competes with your scroll listeners, form validation, and analytics tracking for CPU cycles. A CSS-based teaser animation never blocks interactivity. It also ships faster (6KB vs 50KB), loads faster, and parses faster. The trade-off: you can't make it interactive. But you weren't planning to anyway.
The Architecture: SVG Shapes + CSS Keyframes + Stroke-Dasharray Draw-Ins
Each teaser is an SVG canvas with hardcoded <circle>, <path>, <rect>, and <line> elements. No dynamism. Then CSS keyframes animate the SVG properties: fill, opacity, stroke-dashoffset (for drawing lines), cx/cy (for moving circles), and transform (for rotating or scaling). The key technique is stroke-dasharray + stroke-dashoffset: set a path's stroke-dasharray to its total length, then animate dashoffset from the length to zero to make it draw itself on-screen.
Stagger the animations with animation-delay so elements appear in sequence — pins light up one by one, lines draw from left to right, charts climb from the bottom. Repeat infinitely with animation-iteration-count: infinite. Respect prefers-reduced-motion by removing all animations for users who request them. The result reads as a living dashboard without eating CPU.
Teaser One: CRM Contact Map with Pulsing Pins
A simple geographic scatter plot showing contact locations. Each pin is a circle, rendered as an SVG circle element. The animation: circles fade in on a staggered delay, then pulse infinitely after they're visible. Here's the structure:
<svg viewBox="0 0 800 500" class="w-full">

  <rect x="0" y="0" width="800" height="500" fill="#f0f4f8" />


  <circle cx="200" cy="150" r="8" class="pin pin-1" fill="none" stroke="#10b981" stroke-width="2" />

  <circle cx="450" cy="200" r="8" class="pin pin-2" fill="none" stroke="#3b82f6" stroke-width="2" />

  <circle cx="600" cy="120" r="8" class="pin pin-3" fill="none" stroke="#f59e0b" stroke-width="2" />
</svg>
The CSS animates each pin with a staggered fade-in, then a pulsing scale loop:
@keyframes fadeInPin {
  0% { opacity: 0; r: 2px; }
  100% { opacity: 1; r: 8px; }
}

@keyframes pulsePin {
  0%, 100% { r: 8px; stroke-width: 2px; opacity: 1; }
  50% { r: 12px; stroke-width: 1px; opacity: 0.6; }
}

.pin {
  animation: fadeInPin 0.5s ease-out forwards;
}

.pin-1 { animation-delay: 0s, 0.5s; }
.pin-2 { animation-delay: 0.15s, 0.65s; }
.pin-3 { animation-delay: 0.3s, 0.8s; }

.pin {
  animation: fadeInPin 0.5s ease-out forwards,
             pulsePin 2s ease-in-out 0.5s infinite;
}
Each pin fades in over 0.5s, staggered by 0.15s intervals. Once visible, it pulses every 2 seconds indefinitely. The outer circles grow and fade, the inner circles stay solid. Total: 24 lines of CSS, no JavaScript.
Teaser Two: Multi-Channel Attribution Chart
A grouped bar chart showing attribution across three channels (Google, Meta, LinkedIn) over four quarters. It's a visual mockup — not real data, just convincing shapes. Each bar is an SVG rect; the animation stacks them bottom-up on a loop.
<svg viewBox="0 0 600 300" class="w-full">

  <text x="20" y="280" font-size="12" fill="#666">Q1</text>


  <rect x="40" y="200" width="12" height="80" class="bar bar-g1" fill="#4285f4" />

  <rect x="55" y="210" width="12" height="70" class="bar bar-m1" fill="#1877f2" />

  <rect x="70" y="220" width="12" height="60" class="bar bar-l1" fill="#0a66c2" />


</svg>
The CSS animates each bar's height from 0 to its final value, with staggered delays across columns:
@keyframes growBar {
  0% { height: 0; opacity: 0; }
  100% { height: var(--final-height); opacity: 1; }
}

.bar {
  animation: growBar 0.6s ease-out forwards;
  transform-origin: bottom center;
}

/* Q1 bars */
.bar-g1 { animation-delay: 0s; --final-height: 80px; }
.bar-m1 { animation-delay: 0.1s; --final-height: 70px; }
.bar-l1 { animation-delay: 0.2s; --final-height: 60px; }

/* Q2 bars (0.4s after Q1) */
.bar-g2 { animation-delay: 0.4s; --final-height: 90px; }
/* ... and so on */
After all bars grow in, fade out the entire chart and restart. Add a fade-out animation to the SVG container looping every 8 seconds (4s bars animating in, 2s pause, 2s fade out). Viewers see the chart "run" repeatedly, reinforcing the "this dashboard updates in real time" message.
Teaser Three: Remarketing Flow Diagram
A node-and-arrow flowchart: visitor enters (top), flows through a decision diamond, branches into two paths, and reconverges at the bottom (retargeting pixel fired). Nodes are circles; arrows are paths with stroke-dasharray draw-ins. The animation draws the flow, pulses nodes, and loops infinitely.
<svg viewBox="0 0 400 500" class="w-full">

  <circle cx="200" cy="50" r="20" class="flow-node node-entry" fill="#10b981" />
  <text x="200" y="55" text-anchor="middle" fill="white" font-size="12">Start</text>


  <path d="M 200 70 L 200 120" class="flow-arrow arrow-1"
        stroke="#666" stroke-width="2" fill="none" stroke-dasharray="50" />


  <path d="M 200 140 L 250 170 L 200 200 L 150 170 Z"
        class="flow-node node-decision" fill="#f59e0b" />


  <path d="M 150 170 L 100 250" class="flow-arrow arrow-2"
        stroke="#666" stroke-width="2" fill="none" stroke-dasharray="100" />
  <circle cx="100" cy="270" r="20" class="flow-node node-left" fill="#3b82f6" />


  <path d="M 250 170 L 300 250" class="flow-arrow arrow-3"
        stroke="#666" stroke-width="2" fill="none" stroke-dasharray="100" />
  <circle cx="300" cy="270" r="20" class="flow-node node-right" fill="#3b82f6" />


  <path d="M 100 290 L 150 350" class="flow-arrow arrow-4"
        stroke="#666" stroke-width="2" fill="none" stroke-dasharray="80" />
  <path d="M 300 290 L 250 350" class="flow-arrow arrow-5"
        stroke="#666" stroke-width="2" fill="none" stroke-dasharray="80" />
  <circle cx="200" cy="370" r="20" class="flow-node node-exit" fill="#10b981" />
</svg>
CSS draws the arrows and pulses the nodes:
@keyframes drawArrow {
  0% { stroke-dashoffset: var(--length); }
  100% { stroke-dashoffset: 0; }
}

@keyframes pulseNode {
  0%, 100% { r: 20px; filter: drop-shadow(0 0 0px rgba(0,0,0,0.2)); }
  50% { r: 24px; filter: drop-shadow(0 0 8px rgba(0,0,0,0.4)); }
}

.flow-arrow {
  animation: drawArrow 0.8s ease-out forwards;
}

.flow-node {
  animation: pulseNode 1.5s ease-in-out infinite;
}

/* Stagger entry → decision → branches → convergence */
.arrow-1 { animation-delay: 0s; --length: 50; }
.node-decision { animation-delay: 0.8s; }
.arrow-2, .arrow-3 { animation-delay: 1.6s; }
.node-left, .node-right { animation-delay: 2.4s; }
.arrow-4, .arrow-5 { animation-delay: 3.2s; }
.node-exit { animation-delay: 4s; }
The entire flow animates top-to-bottom over 5 seconds, then pauses for 2 seconds, then fades out and restarts. Viewers see the "remarketing audience flows through the system" message without needing to read a single label.
Mobile Considerations: Animation Speed Scaling
On mobile, longer animations feel sluggish because viewport width is smaller, so perceived motion is slower. Scale animation durations 4× faster on mobile: 0.6s becomes 0.15s, 2s loops become 0.5s loops. Use a media query:
@media (max-width: 768px) {
  .bar {
    animation-duration: 0.15s !important; /* 0.6s → 0.15s */
  }

  .flow-arrow {
    animation-duration: 0.2s !important; /* 0.8s → 0.2s */
  }

  .flow-node {
    animation-duration: 0.375s !important; /* 1.5s → 0.375s */
  }
}
Also reduce canvas size on mobile — set the SVG to 100% width instead of a fixed pixel width, and scale down stroke widths proportionally. A 2px stroke on desktop reads as 5px on mobile; adjust in your CSS.
Respecting Reduced Motion
Users who set prefers-reduced-motion: reduce should see no animations. Remove all keyframes and show a static mockup instead:
@media (prefers-reduced-motion: reduce) {
  * {
    animation: none !important;
  }

  .pin { opacity: 1; r: 8px; }
  .bar { height: var(--final-height); opacity: 1; }
  .flow-arrow { stroke-dashoffset: 0; }
  .flow-node { opacity: 1; }
}
The SVG is still visible; it's just not animating. Users still see what the dashboard looks like without experiencing motion that may trigger disorientation or migraines.
Frequently Asked Questions
Isn't this just a fake dashboard? How is it convincing?
Marketing visitors spend 4–8 seconds per section. They're skimming copy and scanning visuals. A looped animation is convincing enough to reinforce the message ("we have intelligent dashboards") without needing to be interactive. Real dashboards feel "real" because they respond to input; marketing teasers feel "real" because they move with intention and polish. Both work — they just work differently.
Can I make it interactive so users can hover and see tooltips?
Not with CSS animations alone. Interactivity requires JavaScript — hover detection, event handlers, dynamic tooltip positioning. If you need that, you're back to Recharts or Chart.js. The pattern here is "beautiful looped demo". If you need "interactive real-time dashboard", that's a different product tier and a different build. Communicate that distinction clearly in your copy.
How do I make the animation loop feel natural instead of jarring?
Long fade-outs between loops. Don't snap back to the start; add a 1–2s fade (opacity from 1 to 0) before the animation resets. Use animation-delay: var(--delay) to stagger the fade so the entire SVG dims gradually rather than instantly. Also vary the loop timing: a chart that runs for 6s, pauses for 2s, and fades for 1s feels more deliberate than a 4s instant snap.
Can I use scroll-driven animations like in the Sticky Scroll post?
Yes. Teaser animations are usually in the middle of the page, so scroll-driven animations can sync the chart playback to the user's scroll position. If the user scrolls past the teaser fast, the animation accelerates. If they linger, the animation slows. This feels more organic but requires scroll-timeline (modern browsers) or a scroll event listener + JavaScript. For a pure CSS approach, stick to infinite loops.
What's the performance impact on old browsers?
CSS keyframe animations are supported in all browsers since 2013. Stroke-dasharray is supported since 2015. If a browser doesn't support animations, the SVG renders static. Test in your oldest target browser (usually IE11 if you support that; more likely Safari 14 or older Android browsers). Most ship gracefully — they just show a still frame.
Can I sync multiple teasers on the same page?
Yes, but carefully. All CSS animations are frame-synced by the browser, so animations with the same duration and start delay will loop in sync automatically. If you want a 6-second bar chart and a 12-second flow diagram to loop together, multiply the flow duration so both hit a common loop point (e.g., 12s = 2× 6s). Use CSS custom properties (--duration) to make this maintainable:
--duration-chart: 6s;
--duration-flow: calc(var(--duration-chart) * 2);

.bar { animation: growBar 0.6s ease-out forwards, ... var(--duration-chart) infinite; }
.flow-arrow { animation: drawArrow 0.8s ease-out forwards, ... var(--duration-flow) infinite; }
The Bottom Line
Dashboard teasers are selling props, not real products. CSS animations deliver 80% of the visual impact with 5% of the payload of a JavaScript charting library. One SVG, a few dozen lines of keyframes, and prefers-reduced-motion coverage = a dashboard that moves 60fps, loads fast, and never blocks user interaction. Implement one behind your feature copy, watch session duration climb as users linger longer on the page, and ship the next one knowing you didn't add 50KB to the bundle. For custom teaser designs or multi-page animation orchestration, book a design call at /pricing.