







Three weeks ago you inherited a dashboard. The previous team hand-rolled SVG with D3 v4 — thirty invisible dependencies, a 120KB bundle, and a tooltip that breaks when you resize the window. Every time a designer asks for a colour change, you're digging into Scalable Vector Graphics instead of updating a token. When mobile users shrink the viewport, the chart gets clipped. New requirement: add a legend. That's another 400 lines of path math.
This is why most SaaS teams reach for a library. But which one? Material-UI bundled 90KB just for charts (and you're using V5, not V6). Victory is cleaner than D3 but still verbose — you're writing 15 props for a line chart that should take 3. Recharts landed in 2015 and nobody talks about it anymore, but Velocity X's dashboards ship on it because it's the only one that feels designed for React component thinking: declarative, composable, and your colors live in CSS variables.
Three Libraries, Three Philosophies
D3: Low-level rendering engine. You own every pixel. Bundle: 35KB (d3-core). Data binding, scales, axes — all yours to orchestrate. Ceiling is limitless if you're willing to spend weeks. Floor is "I need a line chart and a tooltip," which should take 5 minutes but takes 5 days. Best if: your chart is bespoke (custom interaction, weird data shape, academic visualization). Worst if: you just need insurance dashboards to look polished without engineering bravery.
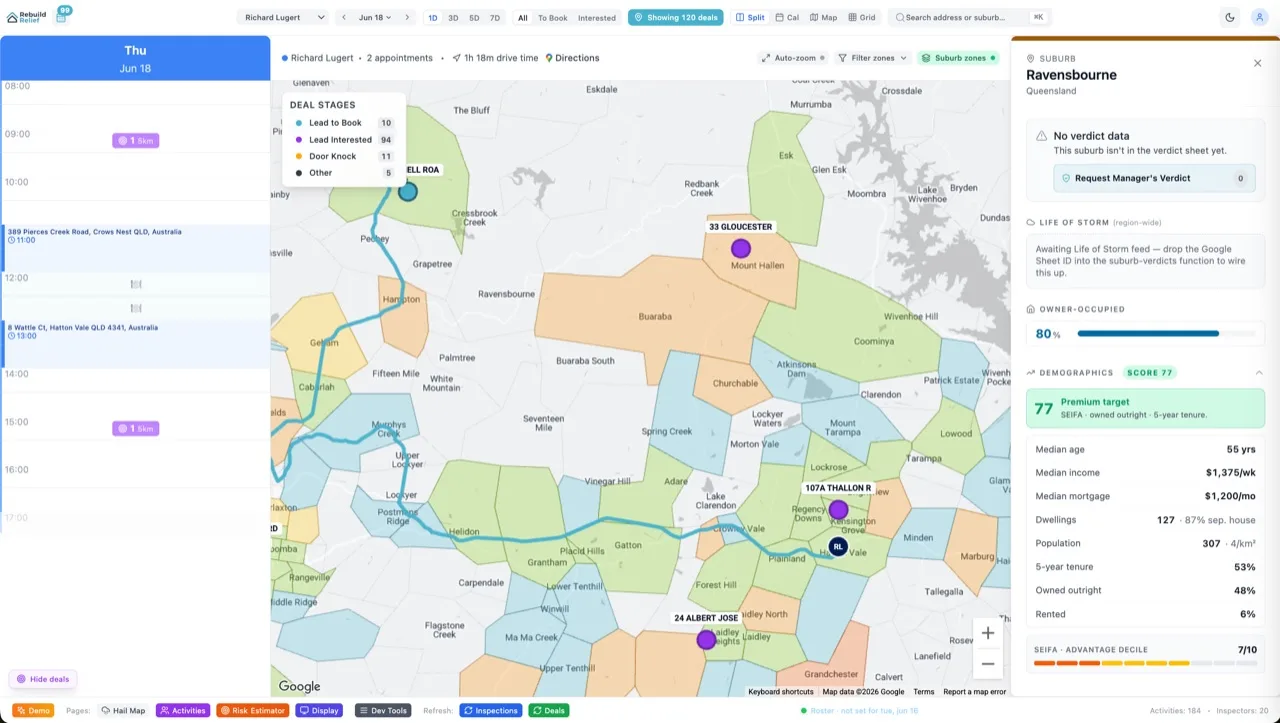
Victory: Component-driven wrapper around d3-scale and d3-shape. Bundle: 45KB. Better than raw D3 because you import a LineChart component and hand it data. But you're still prop-drilling every customization (axis labels, grid, tooltips, legends). Want a custom tooltip? Pass a VictoryTooltip component with twenty props. Three projects in, you've built a wrapper component that wraps the wrapper. Velocity X tested Victory on the Rebuild Relief staff tool, felt heavier than the benefit, and jumped.
Recharts: React-first composable chart library built on Visx (Visx is Victory's smarter cousin). Bundle: 60KB but you're likely already importing React, PropTypes, classnames. Declarative: you nest LineChart, Line, CartesianGrid, Tooltip, Legend — reads like JSX. Responsive by default: ResponsiveContainer measures the parent and reflows when the viewport changes. Colors from CSS tokens: <Line dataKey="revenue" stroke="var(--primary)" />. Ecosystem: built-in composition for multi-series, stacked charts, area fills, custom tooltips with Recharts' Shape utilities. This is what a React person would design if they ignored D3 maturity and just built "how should this feel?" Velocity X's dashboards (revenue forecasts, job location heatmaps, team capacity) all use Recharts because the code is boring in the best way.
The Comparison Table
| Dimension | D3 | Victory | Recharts |
|---|---|---|---|
| Bundle | 35KB gzip | 45KB gzip | 60KB gzip |
| Learning Curve | Steep (math required) | Moderate (many props) | Shallow (composable JSX) |
| Responsive | Write your own | Needs library | ResponsiveContainer built-in |
| Customization | Infinite (raw SVG) | High (props + style) | High (props + composition) |
| CSS Theming | Manual (calculateColor) | Manual (theme prop) | Native (CSS variables) |
| Best For | Academic / bespoke | Custom styling | SaaS dashboards |
Minimal Recharts Line Chart
Here's what a revenue forecast chart looks like in Recharts. No state management, no calculations, no resize observer:
import { LineChart, Line, CartesianGrid, Tooltip, Legend, ResponsiveContainer } from 'recharts';

const data = [
  { month: 'Jan', revenue: 4000, forecast: 2400 },
  { month: 'Feb', revenue: 3000, forecast: 2200 },
  { month: 'Mar', revenue: 2000, forecast: 2290 },
  { month: 'Apr', revenue: 2780, forecast: 2000 },
  { month: 'May', revenue: 1890, forecast: 2181 },
  { month: 'Jun', revenue: 2390, forecast: 2500 },
];

export function RevenueChart() {
  return (
    <ResponsiveContainer width="100%" height={400}>
      <LineChart data={data}>
        <CartesianGrid strokeDasharray="3 3" />
        <Tooltip />
        <Legend />
        <Line type="monotone" dataKey="revenue" stroke="var(--primary)" strokeWidth={2} />
        <Line type="monotone" dataKey="forecast" stroke="var(--accent)" strokeWidth={2} strokeDasharray="5 5" />
      </LineChart>
    </ResponsiveContainer>
  );
}
That's it. ResponsiveContainer watches the parent element and reflows on resize. Tooltip appears on hover with zero extra code. Legend is one line. Lines pull colors from CSS variables — swap the token, every chart updates. This is Recharts: you describe *what* you want, not *how* to render it.
Four Production Patterns
1. Custom Tooltip — Contextual Data
Default Recharts tooltip is a gray box. Real dashboards need context: show the trend, highlight the outlier, link to details. Write a custom component:
function CustomTooltip({ active, payload }) {
  if (!active || !payload?.length) return null;

  const { revenue, forecast } = payload[0].payload;
  const variance = ((revenue - forecast) / forecast * 100).toFixed(1);

  return (
    <div className="bg-white dark:bg-slate-800 border border-slate-200 dark:border-slate-700 rounded p-3 shadow-lg">
      <p className="text-sm font-semibold">{payload[0].payload.month}</p>
      <p className="text-xs text-slate-600 dark:text-slate-400">Actual: ${revenue.toLocaleString()}</p>
      <p className="text-xs text-slate-600 dark:text-slate-400">Forecast: ${forecast.toLocaleString()}</p>
      <p className={`text-xs font-semibold ${variance > 0 ? 'text-green-600' : 'text-red-600'}`}>
        Variance: {variance}%
      </p>
    </div>
  );
}

// Then in your chart:
<Tooltip content={<CustomTooltip />} />
Plug in the component, reference the payload properties, and your tooltip now speaks business language. No magic, no escaping the render loop.
2. Brand Colors via CSS Variables
Velocity projects define primary, secondary, accent in globals.css. Recharts reads them as strings:
// globals.css
:root {
  --primary: 265 90% 50%;        /* Purple for your brand */
  --secondary: 0 0% 8.8%;        /* Near-black */
  --accent: 48 96% 53%;          /* Gold */
  --success: 120 100% 40%;       /* Green */
  --warning: 45 93% 51%;         /* Amber */
  --destructive: 0 84% 60%;      /* Red */
}

// In your chart:
<Line dataKey="revenue" stroke={`hsl(var(--primary))`} />
<Line dataKey="forecast" stroke={`hsl(var(--accent))`} />
<Area dataKey="capacity" fill={`hsl(var(--success) / 0.1)`} />
When the design system shifts (rebranding HailHero or onboarding Staff Operations Dashboard), the tokens change once. Every chart updates automatically. No component prop drilling, no theme context, no Zustand selector overhead.
3. Responsive Stacked Area + Grid
Multi-series stacked area is common in SaaS (revenue by product, capacity by team). Recharts composes it like building blocks:
<ResponsiveContainer width="100%" height={400}>
  <AreaChart data={data}>
    <defs>
      <linearGradient id="colorRevenue" x1="0" y1="0" x2="0" y2="1">
        <stop offset="5%" stopColor={`hsl(var(--primary))`} stopOpacity={0.8}/>
        <stop offset="95%" stopColor={`hsl(var(--primary))`} stopOpacity={0}/>
      </linearGradient>
    </defs>
    <CartesianGrid strokeDasharray="3 3" vertical={false} />
    <Tooltip />
    <Area type="monotone" dataKey="productA" stackId="1" fill="hsl(var(--primary))" />
    <Area type="monotone" dataKey="productB" stackId="1" fill="hsl(var(--accent))" />
    <Area type="monotone" dataKey="productC" stackId="1" fill="hsl(var(--secondary))" />
  </AreaChart>
</ResponsiveContainer>
Gradients, stacking, grid off on the y-axis — all one-liners. Mobile? ResponsiveContainer shrinks the chart, axes rotate, spacing adjusts. No JavaScript media queries, no state machines.
4. Animations On Load
Dashboards feel alive when charts animate in. Recharts has built-in easing:
<LineChart data={data} margin={{ top: 5, right: 30, left: 0, bottom: 5 }}>
  <Line
    type="monotone"
    dataKey="revenue"
    stroke="var(--primary)"
    dot={false}
    isAnimationActive={true}
    animationDuration={800}
    animationEasing="ease-in-out"
  />
</LineChart>
Or wrap the chart in a Framer Motion <motion.div> and tie animations to parent scroll or viewport entry. Recharts doesn't fight with other animation libraries — it just renders, and you layer choreography on top.
Six FAQs
D3 is legendary. Why not just learn D3?
D3 is a 35KB engine. Learning D3 means learning scales, domains, ranges, selections, data binding, and SVG paths. For a dashboard, you're spending engineering effort on "how to draw" instead of "what insights to show." D3 wins if your chart is an anomaly (geographic map with custom projection, force-directed graph, academic network). For CRUD dashboards (line, bar, area, pie), Recharts is 100× faster to ship. Skip D3 unless the chart is genuinely novel.
What about Visx (from Airbnb)?
Visx is D3 primitives in React (scales, axes, shapes). It's lighter than D3 but more work than Recharts. Use Visx if you're building a reusable charting library for your org; use Recharts if you're building dashboards for your customers.
How do I handle real-time data (WebSocket updates)?
Recharts doesn't care where the data comes from. Update state, pass it to the chart, it reflows. Use Zustand for chart state, subscribe to WebSocket events, dispatch to Zustand, component re-renders, chart updates. No special Recharts APIs — just React state management.
Can Recharts handle 10K data points without choking?
Recharts renders SVG, so 10K points = 10K DOM nodes. SVG rendering tanks at ~3–5K points depending on browser and interactivity. If you need dense time-series (stock charts, sensor data), use canvas (Recharts doesn't support it natively). Alternatives: Visx (you own the rendering), Apache ECharts (canvas-based, heavy), or deck.gl (WebGL, overkill for most dashboards). For typical SaaS (daily/weekly aggregates), Recharts handles 500–2K points easily.
Does Recharts work with TypeScript?
Yes. Recharts has full TypeScript support (via DefinitelyTyped). Your data shape is loose, but that's on you to validate with Zod before rendering. Component props are fully typed.
How do I export charts as PNG/PDF?
Use html2canvas (PNG) or jsPDF + html2canvas (PDF). Recharts renders SVG, so the DOM is static and easy to capture. Most SaaS dashboards don't need download — if they do, invest 2 hours in a screenshot button and move on.
The Bottom Line
Pick your chart library based on your ceiling, not your average. D3 has unlimited customization — use it when you're breaking new ground in data storytelling. Victory is a solid middle ground — use it if your team already bought the prop-drilling model. Recharts is the fastest path to a polished dashboard: declarative JSX, responsive by default, CSS variable theming, and zero boilerplate. Velocity X's dashboards (Rebuild Relief staff tool, Staff Operations Dashboard analytics) ship on Recharts because the code stays boring and the UX stays smooth. Pair it with custom dashboard builds where your data visualization strategy matters more than the rendering library, and you've got a system that scales from day 1 to Series B. Ship the chart in an afternoon. Spend the week on the insights instead.