







Most dashboards open with 12 tiles arranged in a 3×4 grid. You get CPU usage, request latency, error rate, cache hit, memory footprint, database connections, and six more metrics that changed by 0.3% overnight and absolutely do not matter. Your product manager is scrolling past all of them to find the three numbers she cares about: revenue, activation, and churn.
The Aidxn standard is the opposite. Four cards. Top row: Revenue and Active Users (scope, scale). Bottom row: Conversion and Churn (quality, retention). Each card has one job: show a number, show the trend, show the delta vs last period, and make it clickable to drill into the time-series or cohort breakdown. No busy work. No status lights. No sparklines that require 30 seconds to parse. This is the pattern every SaaS product should start with, and it scales from day 1 to $10M ARR.
Why Four? Why Not Twelve or Two?
Cognitive load. Four metrics fit on a phone. You can grasp them in under two seconds. Most team members check the dashboard while on a call or between Slack threads — they don't have 30 seconds to hunt down the metric they need. If your dashboard doesn't answer "how's our business" in the first 3 seconds, you've already lost focus.
Two is too few. Revenue and Users are output — they don't tell you why. Conversion and Churn are the "why" — they signal product-market fit (high conversion), engagement (low churn), or friction (declining conversion). Losing a 5-point drop in conversion is subtle but catastrophic. You need to see it instantly.
Twelve is a news feed. You'll add them because they're easy, and then nobody checks the dashboard because it's information overload. Start with four. Add a drill-down view per metric (Revenue Breakdown by Product, User Cohort by Signup Month, Conversion Funnels, Churn by Segment). That's enough structure for a Series A team.
The KPI Card Component
Here's the React pattern that ships in Velocity X. It lives in your component library and gets cloned for each metric:
import { LineChart, Line, ResponsiveContainer } from 'recharts';
import { TrendingUp, TrendingDown } from 'lucide-react';
import { useState, useEffect } from 'react';

interface KPICardProps {
  title: string;
  value: number;
  format: 'currency' | 'percent' | 'number';
  sparklineData: { date: string; value: number }[];
  deltaPercent: number;
  onDrillDown: () => void;
  isLoading?: boolean;
}

export function KPICard({
  title,
  value,
  format,
  sparklineData,
  deltaPercent,
  onDrillDown,
  isLoading,
}: KPICardProps) {
  const [isAnimating, setIsAnimating] = useState(false);

  useEffect(() => {
    if (!isLoading) {
      setIsAnimating(true);
      const timer = setTimeout(() => setIsAnimating(false), 1200);
      return () => clearTimeout(timer);
    }
  }, [value, isLoading]);

  const formattedValue = format === 'currency'
    ? `${(value / 1000).toFixed(1)}K`
    : format === 'percent'
    ? `{value.toFixed(1)}%`
    : value.toLocaleString();

  const isPositive = deltaPercent >= 0;

  return (
    <div
      onClick={onDrillDown}
      className="p-6 bg-white dark:bg-slate-900 border border-slate-200 dark:border-slate-800 rounded-lg cursor-pointer hover:shadow-lg transition-shadow"
    >
      <p className="text-sm text-slate-600 dark:text-slate-400 font-medium">{title}</p>

      <div className={`text-4xl font-bold mt-2 transition-all duration-300 ${isAnimating ? 'scale-105' : 'scale-100'}`}>
        {isLoading ? '—' : formattedValue}
      </div>

      <div className="flex items-center gap-3 mt-4">
        <ResponsiveContainer width="100%" height={40}>
          <LineChart data={sparklineData}>
            <Line
              type="monotone"
              dataKey="value"
              stroke={isPositive ? 'hsl(var(--success))' : 'hsl(var(--destructive))'}
              strokeWidth={2}
              dot={false}
              isAnimationActive={false}
            />
          </LineChart>
        </ResponsiveContainer>

        <div className="flex items-center gap-1 min-w-fit">
          {isPositive ? (
            <TrendingUp size={16} className="text-green-600" />
          ) : (
            <TrendingDown size={16} className="text-red-600" />
          )}
          <span className={`text-sm font-semibold ${isPositive ? 'text-green-600' : 'text-red-600'}`}>
            {isPositive ? '+' : ''}{deltaPercent.toFixed(1)}%
          </span>
        </div>
      </div>

      <p className="text-xs text-slate-500 dark:text-slate-500 mt-3">vs last period</p>
    </div>
  );
}
This is the whole card. No heroic complexity. isAnimating adds a micro-scale pulse on data updates so the metric feels responsive. Sparkline colors flip: green up, red down (in Supabase queries, you'll calculate deltaPercent). Click through to a drill-down detail page — that's where the time-series, cohorts, and segments live.
Four Critical SaaS Metrics
1. Revenue (or MRR/ARR)
In Supabase, you're pulling from an invoices table or aggregating from a subscriptions table scoped to the current month.
-- Supabase SQL: MRR (current month)
select
  coalesce(sum(amount_cents) / 100.0, 0) as current_month_revenue,
  coalesce(
    sum(amount_cents) filter (
      where created_at >= date_trunc('month', current_date) - interval '1 month'
        and created_at < date_trunc('month', current_date)
    ) / 100.0,
    0
  ) as previous_month_revenue
from invoices
where created_at >= date_trunc('month', current_date);

-- Calculate delta:
-- deltaPercent = ((current - previous) / previous) * 100
The number should feel real: show MRR (month), ARR (year), or Total Revenue (all time). If you're pre-product-market-fit, show topline revenue. If you're SaaS, MRR is the north star.
2. Active Users
Typically: users with at least one event in the last 30 days. This is your engagement signal.
-- Active Users (last 30 days)
select
  count(distinct user_id) as active_users_30d,
  count(distinct user_id) filter (
    where last_activity_at >= now() - interval '60 days'
      and last_activity_at < now() - interval '30 days'
  ) as active_users_30d_prev
from user_activity
where last_activity_at >= now() - interval '30 days';
Track it weekly or monthly depending on your product. A SaaS with weekly activation (email tools, Slack bots) should measure weekly active users. Daily measurement for high-touch products like analytics dashboards.
3. Conversion Rate
Signups to paid accounts, or freemium activation. Subtle changes in conversion (2-3 percentage points) signal friction, and they compound over a year.
-- Conversion Rate (30 days)
select
  count(distinct user_id) filter (where plan_type = 'free') as signups,
  count(distinct user_id) filter (where plan_type != 'free') as paid_accounts,
  round(
    100.0 * count(distinct user_id) filter (where plan_type != 'free')
      / count(distinct user_id),
    2
  ) as conversion_percent
from users
where created_at >= now() - interval '30 days';
If your model is trial-to-paid, measure the % who convert from trial. If it's freemium, measure signups-to-paid-activate. The metric should match your growth model exactly.
4. Churn Rate
The percentage of paying customers who cancel or downgrade. Nothing matters if your revenue retention drops. Most teams track this monthly or quarterly.
-- Churn Rate (30 days)
select
  count(distinct user_id) as paid_customers_start,
  count(distinct user_id) filter (
    where cancelled_at is not null
      and cancelled_at <= now()
  ) as churned_customers,
  round(
    100.0 * count(distinct user_id) filter (where cancelled_at is not null)
      / count(distinct user_id),
    2
  ) as churn_percent
from subscriptions
where started_at < now() - interval '30 days'
  and (cancelled_at is null or cancelled_at >= now() - interval '30 days');
Churn is your retention heartbeat. A SaaS with 5% monthly churn at $1M MRR bleeds $50K/month to churn alone — every engineering or product sprint should move this needle.
Sparkline Data — 30-Day History
Each card shows a mini line chart of the last 30 days. Pull daily or weekly aggregates depending on your scale. Here's the pattern for Revenue Sparkline:
-- Revenue by Day (last 30 days, for sparkline)
select
  date_trunc('day', created_at)::date as date,
  sum(amount_cents) / 100.0 as value
from invoices
where created_at >= now() - interval '30 days'
group by date_trunc('day', created_at)
order by date asc;
The sparkline doesn't need labels or axes — just the line. Recharts renders it in 40 pixels height and users grasp the trend at a glance: steady? climbing? cliff? That's enough signal for a dashboard top card.
The Drill-Down Pattern
Each card links to a detail view. For Revenue: break down by product, plan, geography. For Active Users: cohort analysis (signup month, product feature used). For Conversion: funnel breakdown (visitor → free → trial → paid). For Churn: cohort retention, top churn reasons from feedback, win-back campaigns.
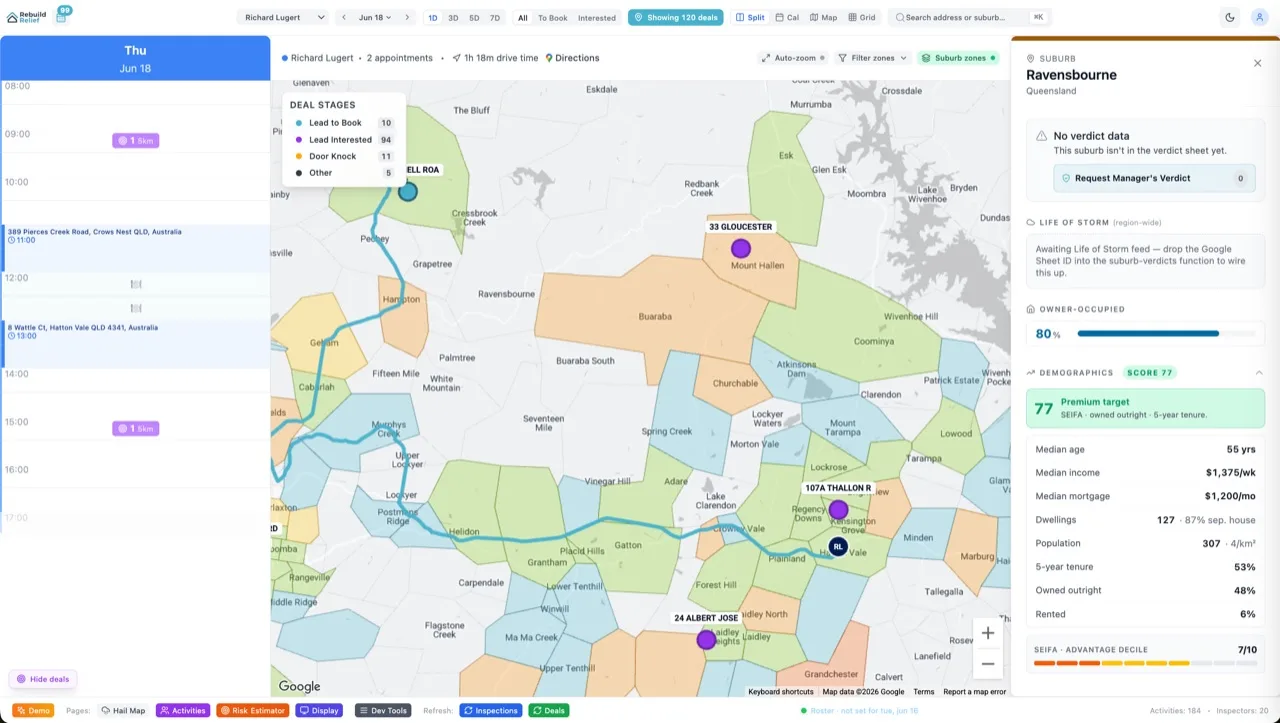
The drill-down lives one click away. The four-card home doesn't try to hold all that detail. If you're trying to fit "Revenue by Product" into the top dashboard, you've added a row. If you've added a row, you've violated the pattern. Keep the top dashboard at exactly four cards and let each card open a rabbit hole of detail. This is how Rebuild Relief's staff tool works: one landing dashboard, click any card to inspect.
Six FAQs
Should I show 24-hour change or 30-day change for the delta?
Neither. Show the same period as your business review cadence. If you review weekly, show week-over-week. Monthly, show month-over-month. Quarterly, show quarter-over-quarter. The delta should match your decision-making frequency. For most SaaS, month-over-month is standard; if you're ops-heavy or hitting growth hockey stick, move to weekly.
What if one of my four metrics is flat or negative every day?
That's usually a data problem (broken tracking, missing events) or a product problem (you're in decline). Fix it. A metric that never changes isn't a metric—it's noise. Replace it with something that moves. If your conversion rate hasn't changed in 90 days, you're either at plateau or you're not measuring activation correctly.
Can I add a fifth card?
Technically yes. Practically, you break the pattern. Four cards fit mobile, one per quadrant. Five forces you into a 2-2-1 layout which asymmetrically pulls visual attention. The moment you add a fifth, someone will ask for a sixth. Stick with four. If you need more signals, open the drill-down views. That's what they're for.
How often should I refresh the data?
Every 60 seconds for revenue and users (near real-time feels alive). Every 24 hours for churn (it's cohort-aggregated and stable). Use Zustand to manage refresh intervals per metric — some refresh fast, some refresh slow. For Rebuild Relief, MRR refreshes every 10 seconds because every new inspection means new revenue; churn refreshes nightly because it's a monthly metric anyway.
What if I'm not using Supabase?
The queries adapt to your database. Postgres syntax (here), MySQL, BigQuery — the logic is identical. You're aggregating revenue by date range, counting distinct users, calculating percentages. If you're on BigQuery (Google Analytics or Firebase), replace date_trunc with DATE and sum() filter with COUNTIF / SUMIF inside CASE. The component stays the same. The queries change based on your stack, but the shape of the card doesn't.
What about alerts or anomaly detection?
Keep it simple on the dashboard. A red number is enough signal to investigate the drill-down view. If you need AI-powered anomaly detection (conversion dropped 2%, statistical significance at 90%), add it to the detail page or send it to Slack. The dashboard home stays clean. The moment you add "flag", "warning icon", and "triggered alert" logic to the four cards, you've piled on complexity. Straight numbers first. Automation second.
The Bottom Line
Start every dashboard with four cards: Revenue, Active Users, Conversion, Churn. Show the big number, the 30-day sparkline, the delta vs last period, and make it clickable. Build your KPI card component once, clone it four times, and ship. Drill-down views (time-series, cohorts, segments) live one click away. This is how Velocity X builds the dashboards that actually get checked every day. The same team that landed you the pattern is available for custom dashboard builds where your metrics strategy and your business logic matter more than the UI framework. Or fork this pattern and own your home dashboard. Either way, cut the cruft: four numbers, zero nonsense, watch your product breathe. See the logic in how we choose chart libraries and you'll understand the whole stack.